Analyze and Optimize Your Production
Visualize your activity and sales using heatmaps. Analyze your most used glazes and best glaze combinations to optimize your production.
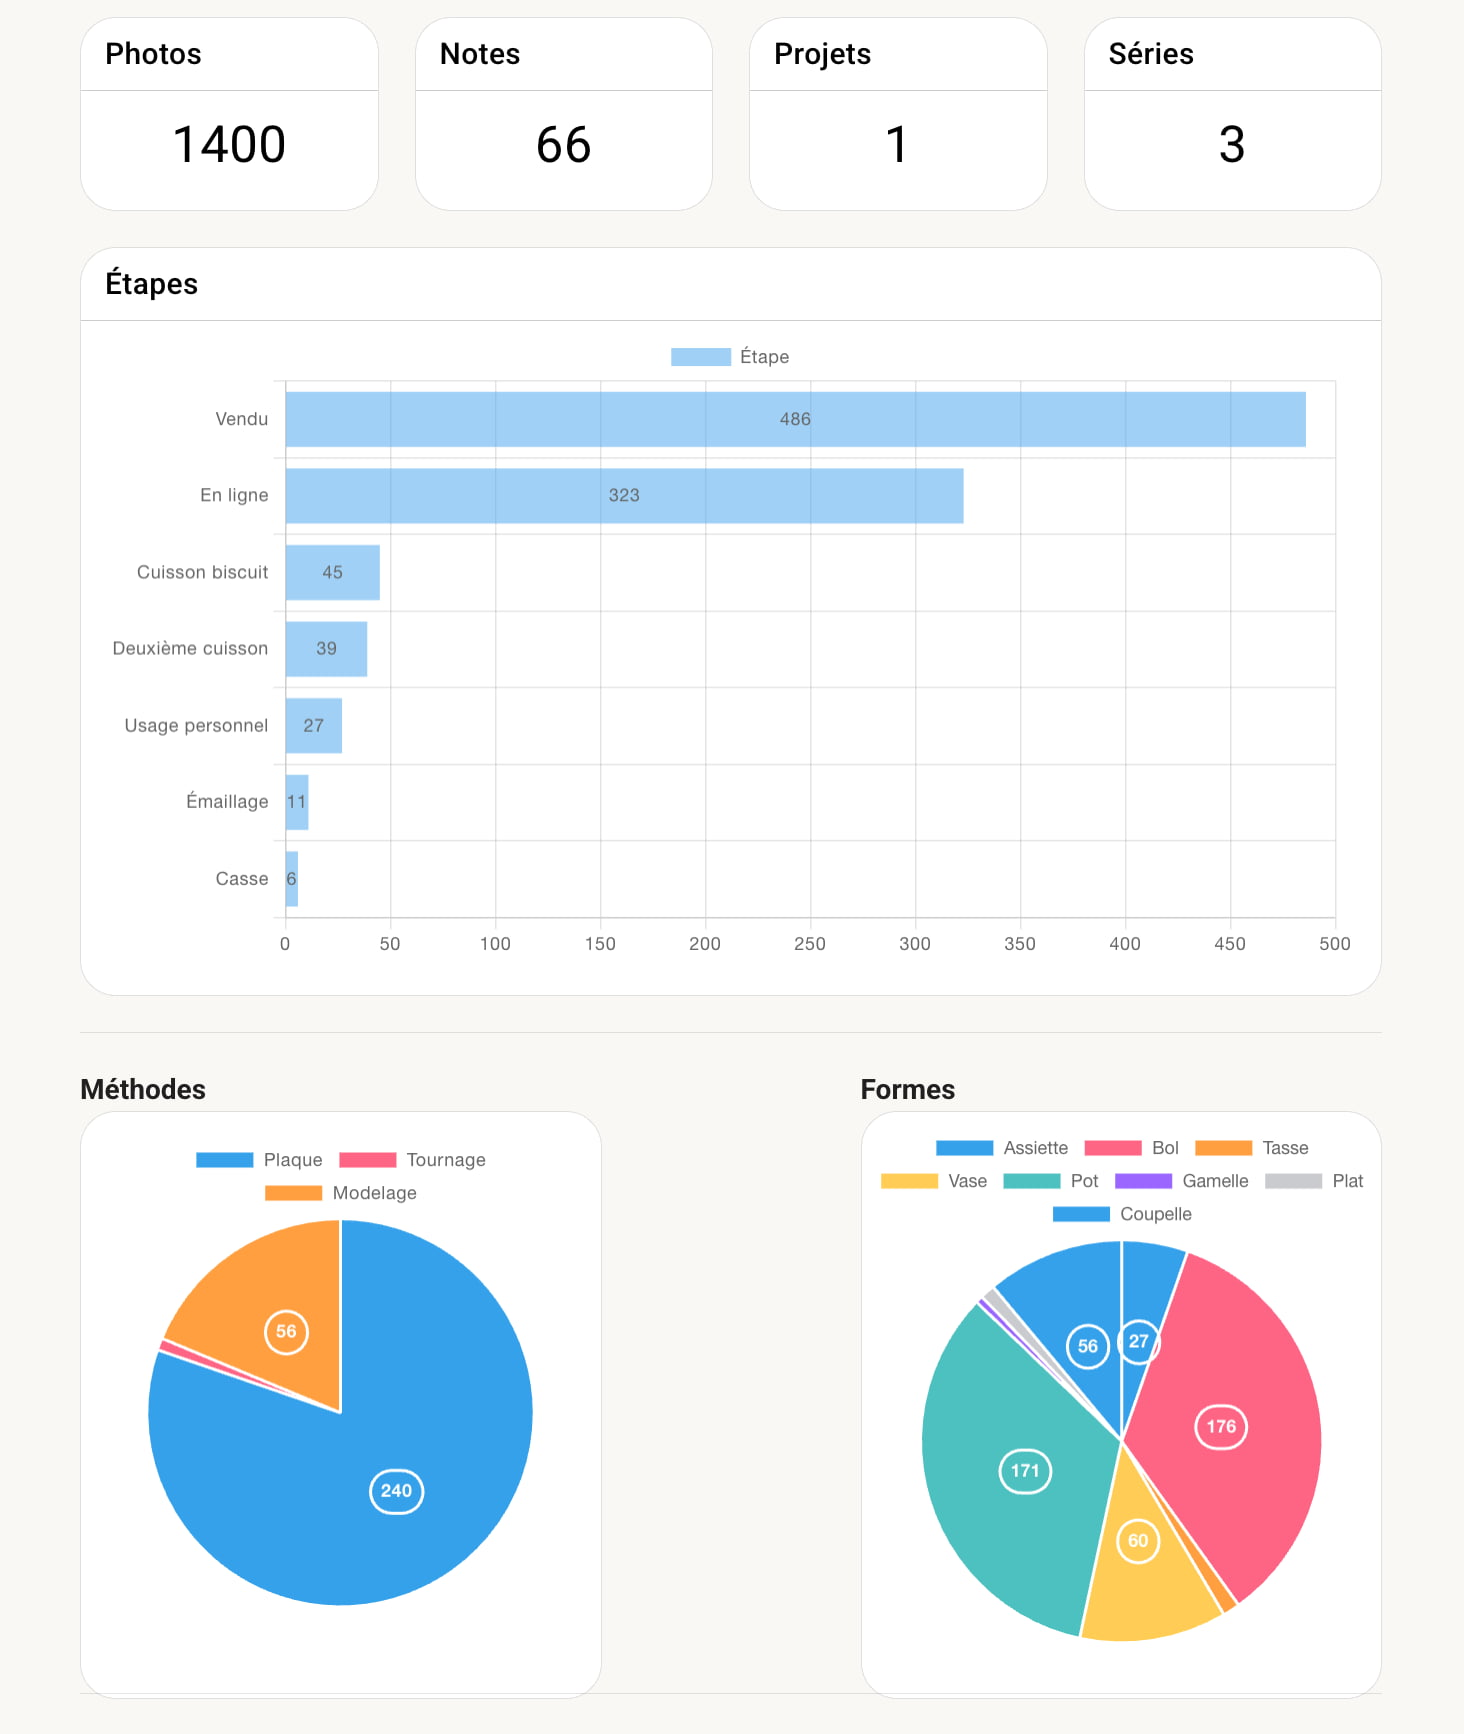
Your studio data holds valuable insights to optimize your daily artisan life. Our statistics tool allows you to understand the pulse of your workshop in an instant.
Activity and Sales Heatmaps: Visualize the regularity of your work and your sales peaks with dynamic heatmaps. Instantly spot your most productive periods and commercial highlights to anticipate your studio needs.
Glazes and Combinations Analysis: Identify your flagship glazes (most used) and discover which glaze superposition or association combinations are most successful. Valuable help to guide your next glazing sessions and streamline your raw material inventory.
Total freedom
The application adapts to your style, not the other way around.
Access everywhere
Your data synchronized on all your devices in real time.
Discover also...
Track Your Sales and Distribution Channels
Record every sale by linking the piece, date, price, and sales channel. Simplify your commercial management and monitor your revenue.
Master Your Firings from A to Z
The most complete firing manager for your studio. Plan, record, and analyze every cycle for perfect results.
Your Studio Anywhere, Anytime
Start a record on your tablet in the studio, complete it on your smartphone, and analyze your results on your computer.
Ready to simplify your studio?
Join a community of potters who have chosen to focus on the essential: creation.
No credit card required. Sign up in 30 seconds.